マックブックな日々(Macbook Geek)

Retina Macbook Proで行った設定、アプリのインストール、トラブル対策等の覚書

NumbersのテーブルをIllustatorにもっていく

Numbersで作ったテーブルを、ベクターデータとしてIllustratorへ持っていくには、PDFを使う。
f:id:yasuda0404:20121224225555p:plain
f:id:yasuda0404:20121224225612p:plain

Illustrator側の読みは、ファイルー開く... か、
f:id:yasuda0404:20121224225246p:plain

ファイルー配置...で行う。
f:id:yasuda0404:20121224224911p:plain

どちらの方法でもNumbersファイルの該当シートを選択し、シート単位で読み込むことになる。
f:id:yasuda0404:20121224225109p:plain

開く...で読み込んだ場合は、テーブルの要素単位で編集できる。一方全体の取り扱いは不便なので、グループ化すると良い。
f:id:yasuda0404:20121224225438p:plain

配置の場合はリンクとするかどうかを読み込み時のチェックマークで選択する。
f:id:yasuda0404:20121224225148p:plain

Excel for mac 2011でグラフを図として保存する

Excel for mac 2011でグラフを作って、画像として保存する方法がわからなかった。ファイルー名前をつけて保存は、あくまでもEXCELのブックやシートの保存のみ。JPEGやPNGなど画像形式は選択できない。

やっと見つけたのは、「グラフエリアで右クリック、図として保存...」と言う方法。マウスカーソルをグラフエリアに置くのがポイントで、プロットエリアだと違うメニューになってしまう。
しかしこれはヘルプを見ても出てこないし、ググっても出てこない。「隠れコマンド」なのだろうか?
f:id:yasuda0404:20121223222311p:plain

AirPlayがつながらなくなったら

iPhoneからAppleTVへのAIrPlayが、最近つながらなくなっていた。原因不明で困っていたが、対象法を見つけた。
iPhoneやiPadから急にAirPlayできなくなったときの対処法 | AppiOS

なんと、機内モードをOn/Offするだけ。つながらなくなったのは、今いるWiFiネットワークの情報が違っているらしく、これをリセットすればよいだけだった。

Shinyのスライダーを使う

参考:Tutorial: Building 'Shiny' Applications with R
Shinyのスライダーは、チュートリアルのexample05に使い方がまとめられている。

1)sliderInput("変数名","表示名",min=最小値, max=最大値, value=初期値)

sliderInput("integer", "Integer:", 
                min=0, max=1000, value=500),

2)sliderInput("変数名","表示名",min=最小値, max=最大値, value=初期値, step=刻み幅)

    # Decimal interval with step value
    sliderInput("decimal", "Decimal:", 
                min = 0, max = 1, value = 0.5, step= 0.1),

3)sliderInput("変数名","表示名",min=最小値, max=最大値, value=c(領域下端、領域上端))

    # Specification of range within an interval
    sliderInput("range", "Range:",
                min = 1, max = 1000, value = c(200,500)),

4)sliderInput("変数名","表示名",min=最小値, max=最大値, value=初期値, step=刻み幅,
format=書式, locale=, animate=TRUE/FALSE)

    # Provide a custom currency format for value display, with basic animation
    sliderInput("format", "Custom Format:", 
                min = 0, max = 10000, value = 0, step = 2500,
                format="$#,##0", locale="us", animate=TRUE),

5)sliderInput("変数名","表示名",最小値, 最大値, 初期値, step=刻み幅,
animate=animationOptions(interval=インターバル, loop=T/F))

    # Animation with custom interval (in ms) to control speed, plus looping
    sliderInput("animation", "Looping Animation:", 1, 2000, 1, step = 10, 
                animate=animationOptions(interval=300, loop=T))

ShinyがReactivityを実現する方法

参考:Tutorial: Building 'Shiny' Applications with R
Shinyの最大の特長が"Reactivity Programming"だ。Shinyのインタラクティビティは、
ユーザ入力>R言語>ウェブ出力
を自動的に実行することで実現されている。入力値や関数の変更を評価し、必要に応じてRコードを再実行するしくみがReactivityで、ShinyはReactivityライブラリを提供している。Reactivity Programmingでは、変更を陽にモニターする必要はない。

次のExampleコードを見てみる。
ui.R

library(shiny)

# Define UI for dataset viewer application
shinyUI(pageWithSidebar(

  # Application title
  headerPanel("Reactivity"),

  # Sidebar with controls to provide a caption, select a dataset, and 
  # specify the number of observations to view. Note that changes made
  # to the caption in the textInput control are updated in the output
  # area immediately as you type
  sidebarPanel(
    textInput("caption", "Caption:", "Data Summary"),

    selectInput("dataset", "Choose a dataset:", 
                choices = c("rock", "pressure", "cars")),

    numericInput("obs", "Number of observations to view:", 10)
  ),


  # Show the caption, a summary of the dataset and an HTML table with
  # the requested number of observations
  mainPanel(
    h3(textOutput("caption")), 

    verbatimTextOutput("summary"), 

    tableOutput("view")
  )
))

server.R

library(shiny)
library(datasets)

# Define server logic required to summarize and view the selected dataset
shinyServer(function(input, output) {

  # By declaring datasetInput as a reactive function we ensure that:
  #
  #  1) It is only called when the inputs it depends on changes
  #  2) The computation and result are shared by all the callers (it 
  #     only executes a single time)
  #  3) When the inputs change and the function is re-executed, the
  #     new result is compared to the previous result; if the two are
  #     identical, then the callers are not notified
  #
  datasetInput <- reactive(function() {
    switch(input$dataset,
           "rock" = rock,
           "pressure" = pressure,
           "cars" = cars)
  })

  # The output$caption is computed based on a reactive function that
  # returns input$caption. When the user changes the "caption" field:
  #
  #  1) This function is automatically called to recompute the output 
  #  2) The new caption is pushed back to the browser for re-display
  # 
  # Note that because the data-oriented reactive functions below don't 
  # depend on input$caption, those functions are NOT called when 
  # input$caption changes.
  output$caption <- reactiveText(function() {
    input$caption
  })

  # The output$summary depends on the datasetInput reactive function, 
  # so will be re-executed whenever datasetInput is re-executed 
  # (i.e. whenever the input$dataset changes)
  output$summary <- reactivePrint(function() {
    dataset <- datasetInput()
    summary(dataset)
  })

  # The output$view depends on both the databaseInput reactive function
  # and input$obs, so will be re-executed whenever input$dataset or 
  # input$obs is changed. 
  output$view <- reactiveTable(function() {
    head(datasetInput(), n = input$obs)
  })
})

ui.Rでは、

  • "caption"という名前の textInput
  • "dataset"という名前のselectInput
  • "obs”という名前のnumericInput

を定義している。


server.Rの先頭が、

shinyServer(function(input, output) {

となっている。関数に渡されるinput, output各オブジェクトがuiとのやり取りを媒介している。

inputオブジェクトはウェブページ上の入力をリスト形式で取得する。Reactivityは通常の関数を"reactive"関数に渡すことで実現する。下の例では、datasetInputをreactive関数として宣言している。

datasetInput <- reactive(function() {
   switch(input$dataset,
          "rock" = rock,
          "pressure" = pressure,
          "cars" = cars)
})

一方、出力はoutputオブジェクトを使う。下では、textinput "caption"への入力を、そのまま"caption"へ文字出力(reactiveText)している。

 output$caption <- reactiveText(function() {
    input$caption
  })

次では、datasetinputの再実行(つまり、input$datasetの変更)を見て、summary関数の出力を、outputオブジェクトの"summary"として表示(reactivePrint)している。

output$summary <- reactivePrint(function() {
    dataset <- datasetInput()
    summary(dataset)
  })

こちらは、datasetInputの再実行(つまり、input$datasetの変更)または、numericInput"obs"の変更が生じた場合に、outputオブジェクトの"view"が変更される(reactiveTable)。

output$view <- reactiveTable(function() {
    head(datasetInput(), n = input$obs)
  })

ShinyのUI プルダウン・セレクターを使う

参考: Tutorial: Building 'Shiny' Applications with R
ui.R

library(shiny)

# Define UI for dataset viewer application
shinyUI(pageWithSidebar(

  # Application title
  headerPanel("Shiny Text"),

  # Sidebar with controls to select a dataset and specify the number
  # of observations to view
  sidebarPanel(
    selectInput("dataset", "Choose a dataset:", 
                choices = c("rock", "pressure", "cars")),

    numericInput("obs", "Number of observations to view:", 10)
  ),

  # Show a summary of the dataset and an HTML table with the requested
  # number of observations
  mainPanel(
    verbatimTextOutput("summary"),

    tableOutput("view")
  )
))

ui.Rの構造は、

shinyUI
    pageWithSidebar
        headerPnael
        sliderPanel
            selectInput
            numericInput
        mainPanel
            verbatimTextOutput
            tableOutput

となっている。ブロック単位が明確でわかりやすい。また「位置」の情報は必要なく、ブラウザ画面のサイズにあわせて自動的にレイアウトしてくれる。

server.R

library(shiny)
library(datasets)

# Define server logic required to summarize and view the selected dataset
shinyServer(function(input, output) {

  # Return the requested dataset
  datasetInput <- reactive(function() {
    switch(input$dataset,
           "rock" = rock,
           "pressure" = pressure,
           "cars" = cars)
  })

  # Generate a summary of the dataset
  output$summary <- reactivePrint(function() {
    dataset <- datasetInput()
    summary(dataset)
  })

  # Show the first "n" observations
  output$view <- reactiveTable(function() {
    head(datasetInput(), n = input$obs)
  })
})

"shinyServer(function(input, output) {"に続けて、処置を書く。
input$UI名
で入力を取り出す。例えば、スライダーdatasetの値を受け取るには、
input$dataset
とする。

datasetInput <- reactive(function() {.....} は、reactive関数の部分。この表現は重要。


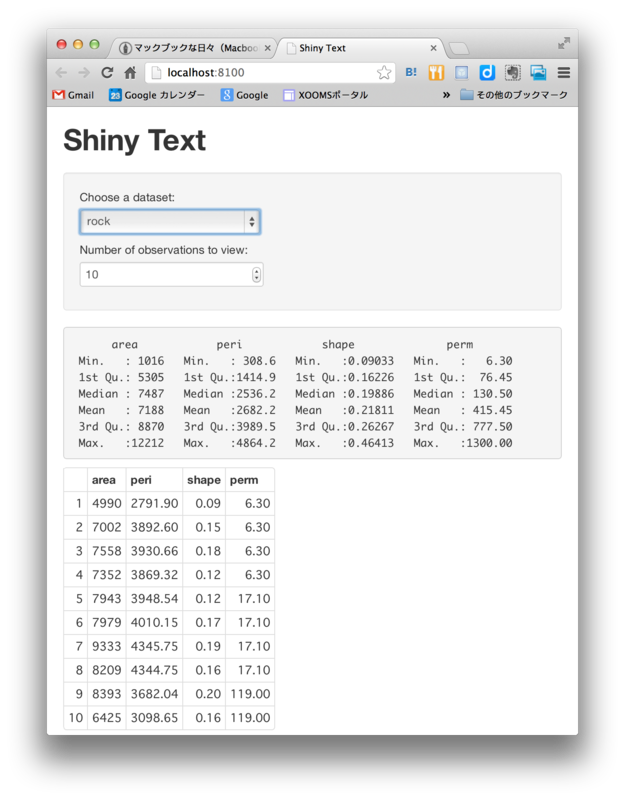
> runApp("フォルダ名")で実行すると、ブラウザで次の画面が表示される。
f:id:yasuda0404:20121123151033p:plain:W480

プルダウンセレクターと数値カウンターの入力は、即座にプロットに反映される。

Shinyを使ってみる

参考:Tutorial: Building 'Shiny' Applications with R
Shinyのアプリは
アプリ名を表すフォルダの下に、

  • ユーザインタフェースを定義する、ui.R
  • サーバーサイドの処理を定義する、server.R

の2つのファイルが存在しなければならない。
これら以外のスクリプトやデータがあってもよい。

例えば、"ex01"と言うフォルダを作り、その下に次の2つのRファイルをを作る。

ui.R

library(shiny)

# Define UI for application that plots random distributions 
shinyUI(pageWithSidebar(

  # Application title
  headerPanel("Hello Shiny!"),

  # Sidebar with a slider input for number of observations
  sidebarPanel(
    sliderInput("obs", 
                "Number of observations:", 
                min = 0, 
                max = 1000, 
                value = 500)
  ),

  # Show a plot of the generated distribution
  mainPanel(
    plotOutput("distPlot")
  )
))

server.R

library(shiny)

# Define server logic required to generate and plot a random distribution
shinyServer(function(input, output) {

  # Function that generates a plot of the distribution. The function
  # is wrapped in a call to reactivePlot to indicate that:
  #
  #  1) It is "reactive" and therefore should be automatically 
  #     re-executed when inputs change
  #  2) Its output type is a plot 
  #
  output$distPlot <- reactivePlot(function() {

    # generate an rnorm distribution and plot it
    dist <- rnorm(input$obs)
    hist(dist)
  })
})

実行は、

> runApp("アプリ名(フォルダ名)")

とする。
上の例の場合、アプリフォルダを含むフォルダに作業ディレクトリを変更し(トップメニューの「その他」-「作業ディレクトリの変更...」)、コンソールに次を入力する。

> runApp("ex01")